The Plotter is composed of:
Plotter Input Panel Choices
Surface Pressure or Speed at Surface
![]() These choices display plots of
pressure
or airspeed
along and on the
airfoil surface.
There are
two lines plotted. The green
line corresponds to the values over the top surface of
the airfoil, while
the yellow line
corresponds to the lower airfoil surface. These lines
correspond to the colors
shown in the Airfoil View window. In
some cases the two plotted lines will fall on top of each other
and you will see
only one of the lines.
These choices display plots of
pressure
or airspeed
along and on the
airfoil surface.
There are
two lines plotted. The green
line corresponds to the values over the top surface of
the airfoil, while
the yellow line
corresponds to the lower airfoil surface. These lines
correspond to the colors
shown in the Airfoil View window. In
some cases the two plotted lines will fall on top of each other
and you will see
only one of the lines.
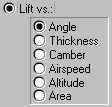
Lift vs.
 Clicking Lift vs lets you generate plots of
lift
as a function of the parameters listed in the radio
buttons:
| Airspeed | Altitude |
| Thickness | Angle of attack |
| Camber height | Wing area |
The plot is automatically rescaled and labeled as you change your selection. You can change any of the Airfoil Input Panel parameters at the lower left, and the variation of lift with this variable will be displayed in the Plotter View Panel.
Plotter View Panel
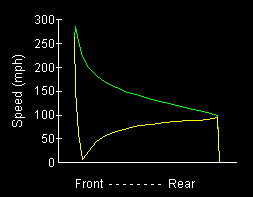
 This is a sample plot of speed from the Front to Rear of the
airfoil. The
green curve represents the speed along the upper
surface of the airfoil, while
the yellow curve is along the
lower surface. These are the same colors used
in the Aifoil
View Panel for the
streamlines above and below the airfoil. The
dip
shown here in the lower curve, near the front, represents the
stagnation
point.
Other Topics
Explore operation of the Baseball Panels
Print and Save the data
Vary the
input parameters on the Airfoil Input
Panel
Explore the flowfield by using
the Probe Control