Return to Contents
Baseball Panels
If you click the "Play Ball"
button at the bottom of the screen, the view panel
will show
a schematic drawing of the baseball flow problem.
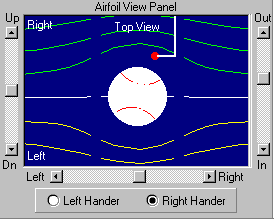
 The Baseball View Panel displays the ball
and the
streamlines of flow
around it as viewed
from above,
looking down. Home plate to
the left and the
pitcher's mound to
the right. The flow appears to move
from left
to right as the ball moves through the air. The
green
streamlines would move around
the right side of the ball
as viewed
by the pitcher while the yellow
streamlines move to
the left. At the bottom of the panel are two buttons to set the
pitcher to either a Right Hander or a Left Hander.
The Up/Down, Left/Right, and
Out/In sliders let you change the position and size of the baseball view.
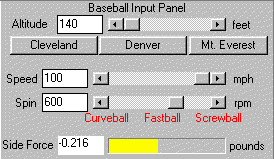
 The Baseball Input Panel
below the View Window is
used
to control the conditions of the
pitch. You can select
the altitude
of
the location; this affects the air
density and the amount of
force
that can
be generated on a curve
ball. Several locations are given as
selection buttons below the
altitude input. The user can vary
the speed of the pitch and the spin put on
the
ball by using the input boxes and sliders. To move the
slider, place the cursor
along the slider and click the left
mouse button. The value of the slider is shown
in the input
box. To more accurately specify the input value, type the value
into
the input box. Simply click in the input box, delete the
original value, type in the
new value, and press
the "Enter" or "Tab" key
when finished. The button on
the slider will move corresponding
to the input box value. For the spin input,
just click
on the red words (Curveball,
Fastball,
Screwball)
located below
the slider and the appropriate spin will be set
on the slider.
As the speed is
increased, the flowing streamlines in the view window will
appear to speed up. As spin is put on the ball, the
view window will show the
ball's rotation and the (slight)
deflection of the streamlines. Spinning the ball
creates a
side force ("Magnus" effect) which causes the ball
to curve in flight.
The magnitude of the side force
is shown in the output box and horizontal
gauge at the bottom
of the input panel. The direction is color-coded to
correspond
with the view window.
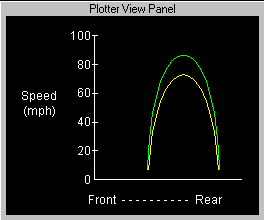
 The Plotter View Panel
displays the
pressure
or speed
variation around the ball. Once
again, the color
of the line
corresponds to the surfaces shown
in the Baseball
View Panel. Notice that the lines separate when a spin is
put on the ball. You can look for these speed differences
using the airspeed probe with the Probe Control Panel.
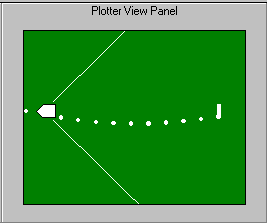
 For the baseball problem a special plotter option
has been included. Pushing the "Ballpark" button
on the
Plotter Input Panel will
change the plotter
display to the
view of a baseball infield. Using this
display,
you can see the
trajectory
of a thrown pitch for the conditions
given in the input
panel. Putting spin
on the ball causes the trajectory
to curve in the Plotter Window.
The trajectory is displayed as
a series
of dots which show the ball's
position at
each 0.05 seconds. The
slower the pitch, the greater the number of dots
which appear. Adding up the number of dots and multiplying
by .05 seconds will give the
time it takes to reach the plate. You may vary the
Release Point
of the pitch and the
Release Angle of the pitch by using
the sliders in the
Plotter Input Panel.
You can explore the flowfield around
the ball by using the Probe Control
Panel
located in the Plotter Input
Panel.
Ready to play! Go
to the Baseball Lessons.
Please send any comments to:
Curator:
Tom.Benson@grc.nasa.gov
Responsible Official:
Kathy.Zona@grc.nasa.gov
 The Baseball View Panel displays the ball
and the
streamlines of flow
around it as viewed
from above,
looking down. Home plate to
the left and the
pitcher's mound to
the right. The flow appears to move
from left
to right as the ball moves through the air. The
green
streamlines would move around
the right side of the ball
as viewed
by the pitcher while the yellow
streamlines move to
the left. At the bottom of the panel are two buttons to set the
pitcher to either a Right Hander or a Left Hander.
The Up/Down, Left/Right, and
Out/In sliders let you change the position and size of the baseball view.
 The Baseball Input Panel
below the View Window is
used
to control the conditions of the
pitch. You can select
the
  The Plotter View Panel
displays the
 For the baseball problem a special plotter option
has been included. Pushing the "Ballpark" button
on the
Plotter Input Panel will
change the plotter
display to the
view of a baseball infield. Using this
display,
you can see the