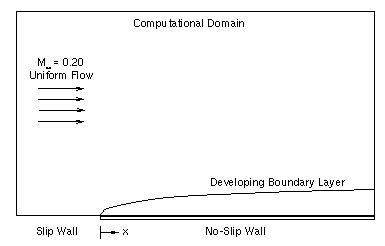
Figure 1. Computational domain for the turbulent flat plate flow case.
Figure 1. Computational domain for the turbulent flat plate
flow case.
This case examines Mach 0.2 flow over a flat plate. The flow conditions are summarized in Table 1. The flow becomes turbulent on the flat plate.
| Mach | Pressure (psia) | Temperature (R) | Angle-of-Attack (deg) | Angle-of-Sideslip (deg) |
|---|---|---|---|---|
| 0.2 | 14.7 | 530.0 | 0.0 | 0.0 |
The geometry is the top surface of the plate with a length of 16.7 feet.
The flow field being modeled is that reported by Wieghardt (1952) and later included in the 1968 AFOSR-IFP Stanford Conference, Coles and Hirst (1969). The data can be accessed through Table 2. To accelerate the convergence rate of these compressible flow solvers for this case, the freestream Mach number was set to 0.20.
| PATEL.data |
| TKE.data |
| WIECF.data |
| WIEVELS.data |
| Study | Category | Person | Comments |
|---|---|---|---|
| Study #1 | Model | D.A. Yoder | Turbulence model and grid resolution study. |
| Study #2 | Model | N.J. Georgiadis | Unstructured grid solution. |
Coles, D.E., and Hirst, E.A., Computation of Turbulent Boundary Layers-1968 AFOSR-IFP-Stanford Conference, Vol. II, Stanford University, CA, 1969.
Patel, Virendra C., Rodi, Wolfgang, and Scheuerer, Georg, "Turbulence Models for Near-Wall and Low-Reynolds Number Flows: A Review," AIAA Journal, Vol. 23, No. 9, pp. 1308-1319, September 1985.
Wieghardt, K., and Tillman, W., "On the Turbulent Friction Layer for Rising Pressure," NACA TM-1314, 1951. [PDF]
Questions or comments about this case can be sent to the respective individuals performing the indicated studies. Otherwise comments can be emailed to John W. Slater at the NASA Glenn Research Center.