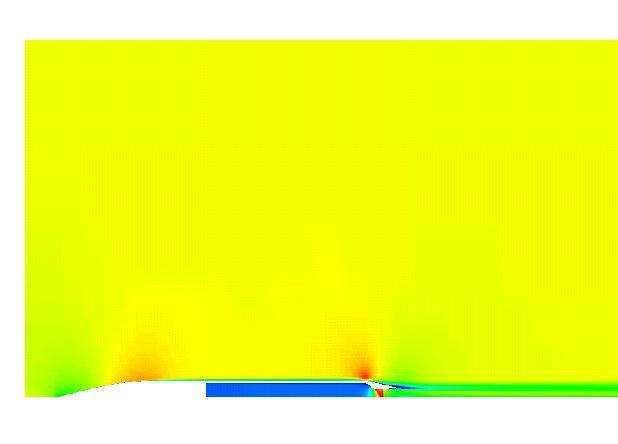
Figure 1. Mach number contours for the MADIC 2D axisymmetric CD boattail nozzle.
Figure 1. Mach number contours for the MADIC 2D axisymmetric CD
boattail nozzle.
The NASA D-1.22-L boattail/nozzle configuration was obtained from the MADIC (Multidisciplinary and Design Industrial Consortium) program, and is thoroughly documented in NASA TP 1766. The conditions are a nozzle pressure ratio (NPR=pt,j/pinfinity) of 1.5, free stream total pressure of 14.71 psia, free stream total temperature of 592 deg. R, free stream Mach Number of 0.8, and a nozzle total pressure of 14.47 psia. The Reynolds number is 306000/in.
All of the archive files of this validation case are available in the Unix compressed tar file madic_axi.tar.Z. The files can then be accessed by the commands:
uncompress madic_axi.tar.Z
tar -xvof madic_axi.tar
The test article consisted of a cylinder with a sharp conical front end. tapered blunt aft end, and a convergent-divergent internal nozzle. The problem domain was decomposed into three separate regions, one for the nozzle interior, another for the external freestream flow down to the exit plane of the nozzle, and a third covering the nozzle exhaust and freestream downstream of the test article.
For zone 1, the upstream boundary was set to diffuser inflow with total conditions specified. The outer boundaries for grids 2 and 3 were set to be freestream with total conditions specified. The downstream outflow boundary of grid 3 was set to confined outflow with the static pressure specified. Test article wall boundaries in all three zones were set to viscous boundaries. Boundaries between zones 1 and 3, and 2 and 3 were abutting coupled. Axis of symmetry boundaries were used elsewhere.
The problem was executed using an interactive WIND code preprocessor which builds and submits a script file to the host machine for the user. For this example problem the solution was generated using one serial run of 5000 cycles (3 iterations per cycle) using Menter's SST turbulence model. The CFL was set at 1.0 . An initially provided grid was transformed into WIND Common File format using a front end utility called cfcnvt (for common file convert). Once the grid common file was obtained it was read into another interactive front end code called GMAN. This utility allows the proper boundary conditions (BC's) to be established and written into the grid common file. A second file called the primary control file is constructed by the user. This file contains the actual values of variables directly related to the flow solution as well as WIND process execution information such as the number of cycles to run, CFL, and turbulence model parameters. The run was submitted into a serial queue on an SGI Origin 2000 and took approximately 3.2 cpu seconds per cycle.
The following files in the tar file (madic_axi.tar.Z) are associated with the run process and are described as follows:
README_case02 - this file:
case02 - directory containing the following files:
madic_axi.xunf - Original grid in plot3d 2d/unformatted/multizone style
madic_axi.cgd - WIND grid and BC common file
madic_axi.cfl - WIND solution common file
madic_axi.dat - WIND primary control input file
madic_axi.lis - WIND output file
p3d.x - Plot3d grid in 2d/unformatted/iblanked/multizone style
p3d.q - Plot3d solution in 2d/unformatted/iblanked/multizone style
madic_axi_gnu - script file controlling line plot for gnuplot
L2.gen - L2 residual time history genplot file
doc_case02 - directory containing plotfiles shown below in postscript format.
cp.ps (Download Accessible PS Plug-in) - pressure coefficient comparison on aft
boattail surface
L2.ps - L2 residual time history plot
The run took approximately 3.2 cpu seconds per cycle on an SGI Origin 2000 for a total of about 16000 seconds.
The solution lineplot is made using gnuplot (available from the GNU Project) for which a plot script file is included to be executed by the user. The comparison line plot is for the aft external boattail nozzle surface starting at an X station of 21.26 inches and extending to the end of the nozzle. The upstream sharp nose of the axisymmetric body is at 0.0 inches. The L2 residual convergence history is generated by first reading the WIND output file into an interactive postprocessor utility called RESPLT which reads the output file and writes out the residual information to a genplot file. Then the genplot file is read into another postprocessing utility called cfpost where the final plot in postscript format is made.
The plot below (cp.ps) compares the computational results of both the NPARC and WIND codes to the experimental data. The comparisons are for pressure coefficients along the aft external wall of the boattail nozzle.
No sensitivity studies were performed.
NASA TP 1766, Investigation of Convergent-Divergent Nozzles Applicable to Reduced-Power Supersonic Cruise Aircraft, Bobby L. Berrier and Richard J. Re, December 1980.
Questions or comments about this case can be sent via email to Mike McClure at the Arnold Engineering Development Center.