At the end of 1901, the Wright brothers were frustrated by the flight
tests of their 1900 and 1901 gliders.
The aircraft were flown frequently up to 300 feet in a single glide. But neither
aircraft performed as well as predicted using the design methods
available to the brothers.
Based on their measurements,
the 1901 aircraft only developed 1/3 of the
lift
which was predicted by using the
Lilienthal data.
During the fall of 1901, the brothers began to question the aerodynamic
data on which they were basing their designs.
Their kite and glider
experiments convinced them that the accepted value of the
Smeaton
pressure coefficient (.005), which is used in both the lift and
drag
design equations, was in error. The brothers determined that
a value closer to .0033 would more accurately describe
their flight tests.
But this did not account for all of the performance differences. There was
still some questions about the lift and drag coefficients which
were obtained by Lilienthal and were being used by the Wrights.
The brothers decided to measure the lift and drag coefficients
themselves. They first built some small models of a wing and a
flat plate and attached them to a
bicycle wheel.
They used the
Lilienthal data to predict the angle of rotation of the wheel
at which the drag of the
flat plate would exactly balance the lift of the wing.
They attached the wheel to the handles of a bicycle and rode through
the streets of Dayton to produce a wind over the models.
The test indicated a much lower value of lift from their model
than the lift predicted by the Lilienthal data. But the test conditions
were hard to control.
So the brothers decided to build a
wind tunnel to produce
a more controlled environment.
They would compare the results they found in the wind tunnel to
the performance they had measured during their kite and glider flights.
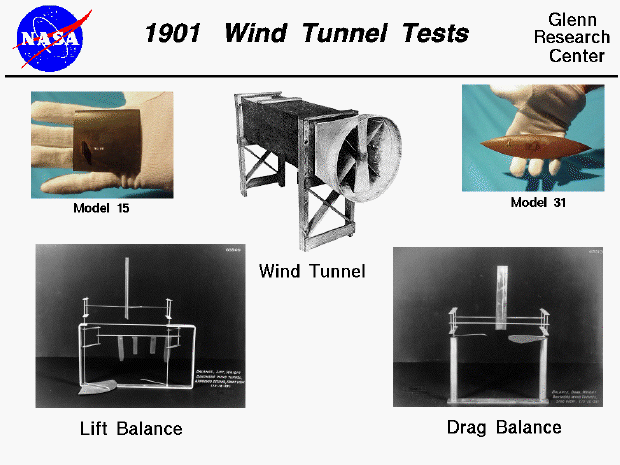
At the top of this page is a picture of a replica of this
wind tunnel.
The wind tunnel was a simple open-return design with a fan
pushing a flow of air through an enclosed square box
and then exiting into the room.
Models of their wings were placed in the test section of the
wind tunnel, at the far left in the figure,
on a forces measuring device. One brother
would record the output of this device by looking through a
glass window on the top of the test section.
To measure the lift and drag, the brothers built two
balances, one for
lift, shown at the lower left,
and the other for
drag, shown at the lower right.
The brothers built models of their wing designs using materials available
in their bike shop. Strips of 20 guage steel (1/32 inch thick) were
cut, hammered, filed and soldered to produce various shapes.
Two of the actual models are shown at the top of this page, with a gloved hand
for a size comparison. These photos are provided by the Franklin Institute
where the actual model are kept.
They made between one and two hundred models and
made quick preliminary tests in
October, 1901, to develop their
test techniques
and to investigate a wide range of design variables.
Some of the models were used in combination to study bi- and tri-wing designs.
They would test each model on both balances to determine the
effect of design variables on lift and drag.
Following the preliminary experiments, they chose about 30 of their
best designs for more detailed
parametric studies.
In these experiments,
only one design variable was changed between models.
Then by comparing the performance
of the two models they could determine the effect of the single
changed variable on lift and drag.
If you use the interactive
wind tunnel simulation,
you can duplicate their results and study these effects for yourself.
The wind tunnel tests were conducted from September to December of 1901. At
the conclusion of the tests, the brothers had the most
detailed data
in the world for the design of aircraft wings.
They used this data to design the 1902 aircraft
which overcame the problems encountered in 1900 and 1901.
They also used the data in the design of their propellers
for the 1903 aircraft.
Navigation..


- Beginner's Guide Home Page
|
