Math Question #33
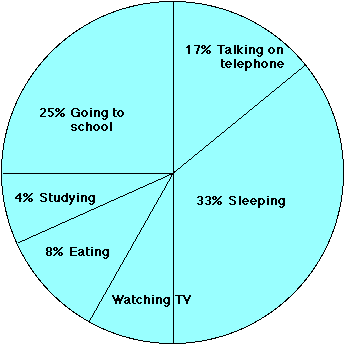
This circle graph shows how Jimmy spent his time during the last 24
hours. What percent of time did he spend watching television?

Back to Proficiency Page
Please send any comments to:
Web Related:
David.Mazza@grc.nasa.gov
Technology Related: Thomas.J.Benson@grc.nasa.gov
Responsible NASA Official:
Theresa M. Scott (Acting)

