This answer is incorrect.
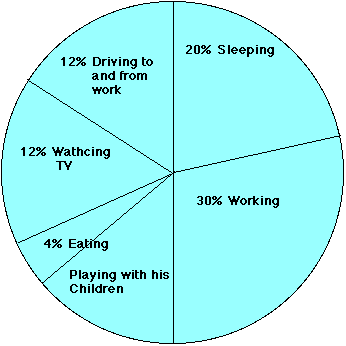
In a chart like this all the percentage must add up to 100%. Therefore all you need to do is to add up all the percentages that are given and subtract that total from 100%
25% + 4 % + 8% + 33% + 17% = 87%
100% - 87% = 13%
Now let us try another one
Mr. Smith the principal of the High School decided to see how he spent his time everyday, so he made the chart you see below. Now how much time does Mr. Smith spend with his children everyday.

Web Related:
David.Mazza@grc.nasa.gov
Technology Related: Thomas.J.Benson@grc.nasa.gov
Responsible NASA Official:
Theresa M. Scott (Acting)