|
Temperature and Pressure
Activities
|

|
If so instructed by your teacher, print out a worksheet
page for these problems.
Predict Temperature and Pressure

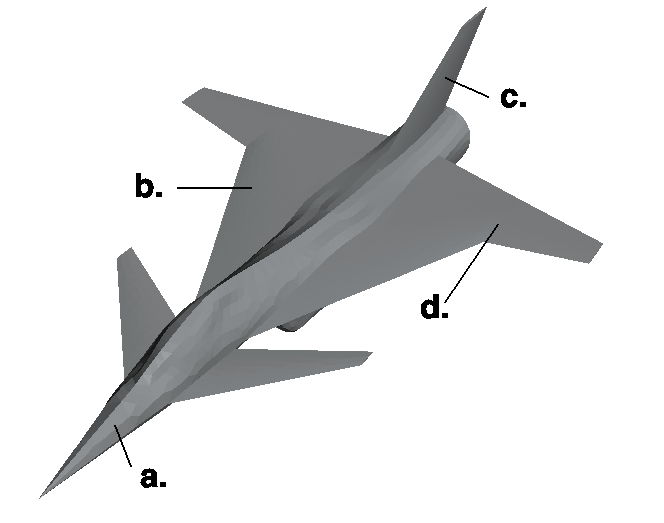
- Using the above diagram, rank the points on an airplane during
flight from 1-4 (1=hottest, 4=coldest).
a. _______ b._______ c. ________ d. ________
- Why do you believe your predictions are correct?
Interpret Temperature and Pressure
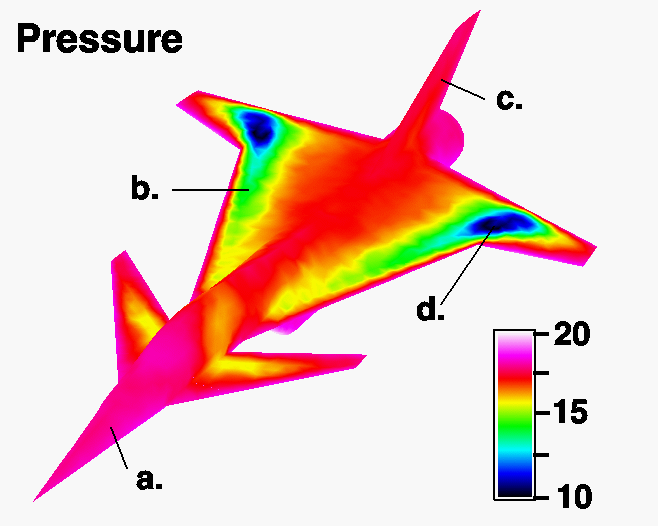
Use the pressure diagram shown below to answer
the following questions.
- Determine the pressure at each of the four points.
a.___________ b.___________ c. ____________ d. ____________
- What is the value of the notch on the chart between 20 and 15?
________________
- What is the value of the notch on the chart between 15 and 10?
________________
- What can you conclude from your observations of the airplane
pressure points?

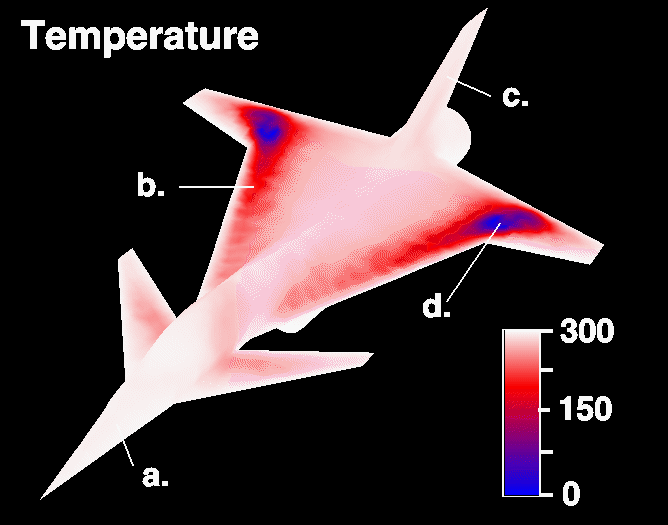
Use the temperature diagram shown below to answer the following
questions.
- Determine the temperature at each of the four points.
a.___________ b.___________ c. ____________ d. ____________
- What is the value of the notch on the chart between 300 and
150? ________________
- What is the value of the notch on the chart between 150 and 0?
________________
- What can you conclude from your observations of the airplane
temperature points?
-

|
