|
Using
FoilSim,
set the following conditions:
Airspeed = 75 mph
Altitude = 0 ft
Angle = 20 degrees
Thickness = 25 %
Camber = 17.5 %
Chord = 1 ft
Span = 1 ft
Use command-shift-3 (on a
Macintosh) or use the "Alt-Print Screen" or "prtscr" button (on
Windows) to screen-capture the page.
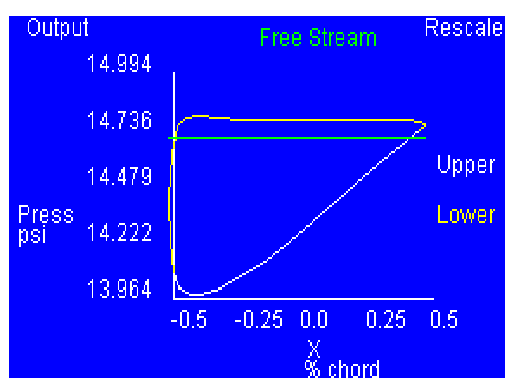
Paste the graph in a word
processing or paint document. Crop the picture so that just
the graph remains as shown in Figure 1. Use the printing
options to enlarge and print the graph.

Figure 1
Be careful with scaling. Since the
Chord setting in the FoilSim control panel was set at 1
ft., the curves displayed will be from 0 inches
to 12 inches, and the area along the X-axis goes from 0 to 144 sq in.
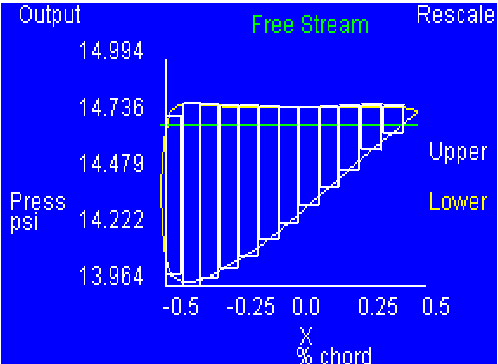
Draw narrow rectangles with equal
widths across the region bounded by the curves (as shown in
Figure 2) and find the area of each. (Be careful with the
scaling.) Create a table and record this
information.

Figure 2
The total area between the curves
is the sum of the individual areas; this value represents
the lift force. Compare your value to the value given by
FoilSim.
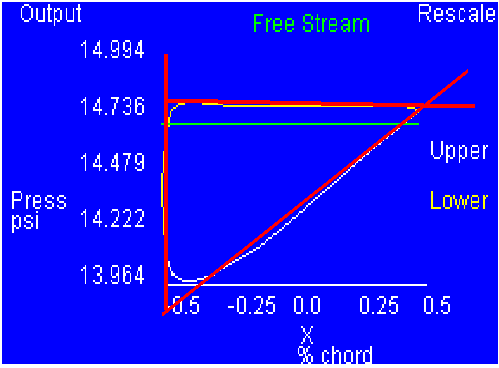
Using the same graph, draw a
straight line along the curves as shown in Figure 3.

Figure 3
Find the slopes of each line and
use them to find the respective equations.
Use integration techniques to find
the area of the enclosed region; this value represents the
lift force. Compare your value to the value given by FoilSim
and to your previous value.
|
