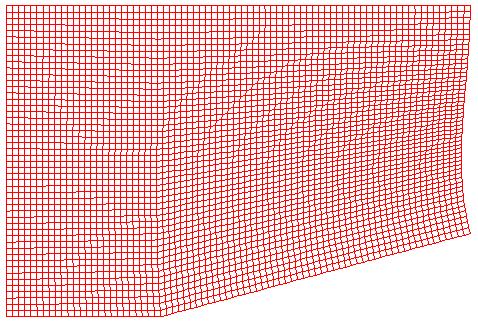
Figure 1. A plot of a representative grid for the wedge.
This document compares the computational performance of WIND and NPARC v3.1.
This case involves the computation of the inviscid, Mach 2.5 flow past a wedge with a half-angle of 15 degrees. This case is discussed in detail in other validation documentation.
WIND and NPARC2D were both run on the workstation seinfeld (R10000) at NASA Lewis for 500 iterations with the CFL number at 5.0. Both runs used the same planar grid ( 308 x 201 ). The computational grid approximated a uniformly spaced grid for most of the flowfield. An example image of the grid is shown below.
Figure 1. A plot of a representative grid for the wedge.
Both computations assummed fixed conditions for the inflow boundary, inviscid walls for the upper and lower boundary, and extrapolation at the outflow boundary.
The Mach number contours are presented below. Both show good capture of the shock, with the WIND solution producing a slightly crisper shock, especially near the foot of the shock.
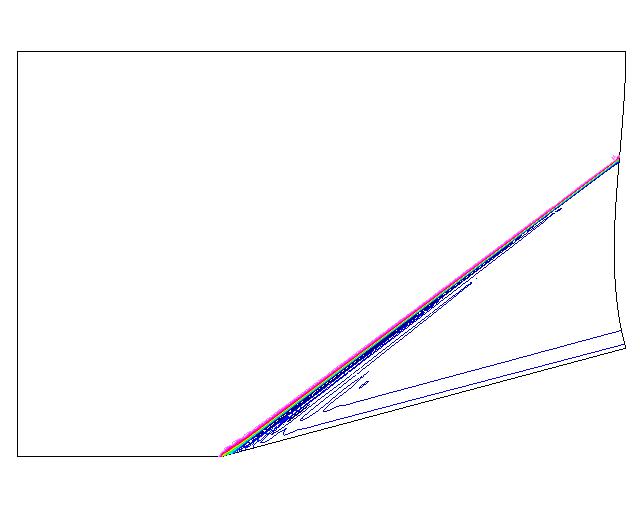
Figure 2. The Mach number contours from NPARC2D for the
Mach 2.5 flow past a 15 degree wedge with the creation of
an oblique shock.
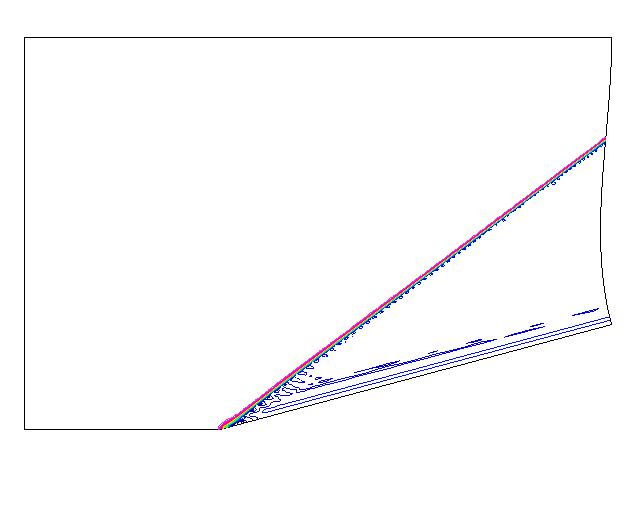
Figure 3. The Mach number contours from WIND for the
Mach 2.5 flow past a 15 degree wedge with the creation of
an oblique shock.
The table below lists some of the data files and results for the computations. The CPU Time is the time for 500 iterations. The WIND computation took 1.9 (540/285) time longer than the NPARC computation. Much of this time difference is due to the fact that WIND is an upwind code, whereas NPARC is a central-difference code. (I am told that such a factor is not uncommon between central-difference and upwind). Some of the time difference may also be due to the fact that WIND was computing a 2D problem using a 3D solver, whereas NPARC2D was used, which solves a 2D problem. The Mach Error listed below is the average error per grid point between the computed and theoretical solutions. The Average Mach is the area-weighted average of the Mach number behind the oblique shock. In parenthesis is the percent error from theory.
| Description | NPARC2D | WIND |
|---|---|---|
| Input Data File | wedgen.C.in | wedgen.C.dat |
| Output File | wedgen.C.out | wedgew.C.lis |
| CPU Time | 284.47 | 539.80 |
| Mach Error | 8.0823457E-07 | 5.6126351E-07 |
| Average Mach (%error) | 1.8905 (0.906%) | 1.8748 (0.068%) |
| Residual File | wedgen.l2.do | wedgew.l2.do |
| Mach -vs- X File | wedgen.mx.do | wedgew.mx.do |
Fig. 4 below shows the convergence history of the computations. Both convergence histories show similar trends. The iteration numbers at which the convergence level out is approximately the same. The oscillations in the WIND convergence history is due to the TVD limiter. When the TVD limiter was turned off ( wedgen.Ca.dat ), the oscillations were removed and a lower level of convergence could be obtained.
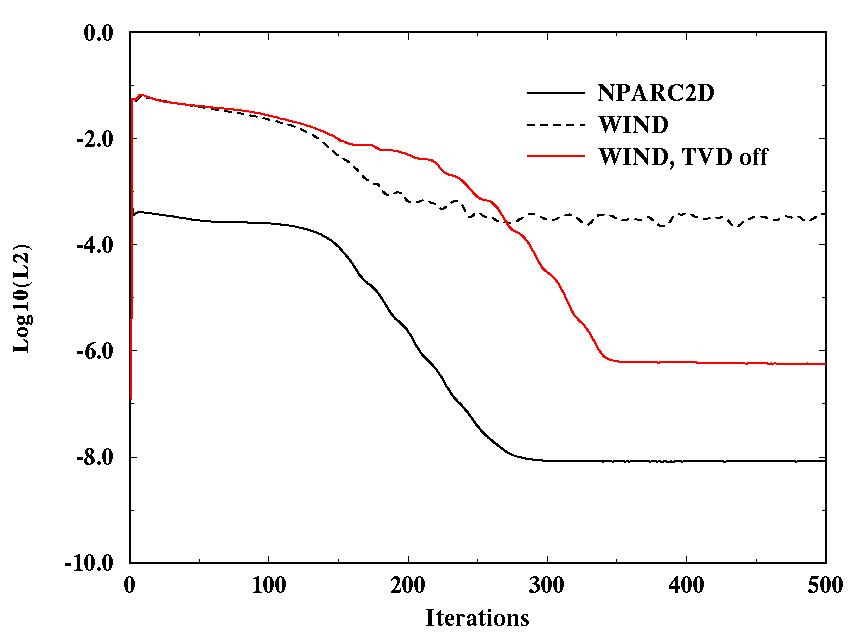
Figure 4. The plots of the convergence histories for the
computations of the Mach 2.5 flow past a 15 degree wedge.
Fig. 5 below shows how the Mach number distribution along the wedge surface compares with oblique shock theory. All compare well with slight oscillations with the WIND with TVD being to best.
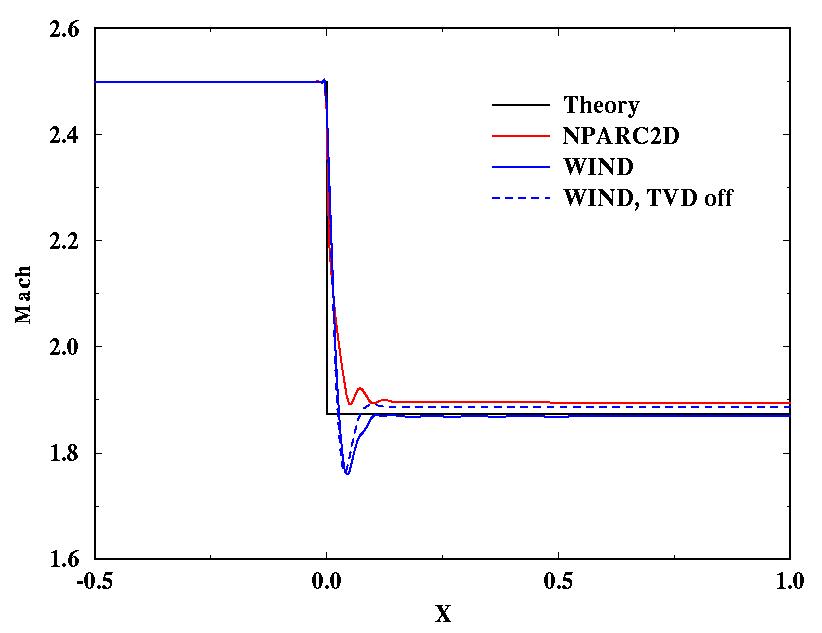
Figure 5. The plots of the Mach number distributions
along the wedge surface as compared to theory.
Questions or comments about this case can be sent be emailed John W. Slater at the NASA Glenn Research Center.