NASA Logo - Web Link to NASA.gov Vertical Line

+ Text Only Site
+ Non-Flash Version
+ Contact Glenn

Go
ABOUT NASA NEWS AND EVENTS MULTIMEDIA MISSIONS MyNASA WORK FOR NASA
NASA Logo

Getting a Little "Lift"
out of Calculus
Part I: Activity

Aeronautics Logo

If so instructed by your teacher, print out a worksheet page for these problems.


Background:


  • Pressure is the change in force per unit of area and can be represented as the derivative
    • P(A) = (d/dA)F or P(A) = dF/dA
  • Therefore, force is the integral of the pressure with respect to area, written as
    • The integral of the pressure times a change of area equals the force
  • To find the net lift force provided by an airfoil with a given set of parameters, subtract the force pushing down on the upper surface from the force pushing up on the lower surface.
  • This causes the integral to become
    • The integral of the upper pressure minnus the lower pressure times the increment of area
                  equals the force

    where PL(A) represents the pressure function acting on the lower surface and PU(A) represents the pressure function acting on the upper surface.


Procedure:

Using FoilSim, set the following conditions:

Airspeed = 75 mph

Altitude = 0 ft

Angle = 20 degrees

Thickness = 25 %

Camber = 17.5 %

Chord = 1 ft

Span = 1 ft

Use command-shift-3 (on a Macintosh) or use the "Alt-Print Screen" or "prtscr" button (on Windows) to screen-capture the page.

Paste the graph in a word processing or paint document. Crop the picture so that just the graph remains as shown in Figure 1. Use the printing options to enlarge and print the graph.
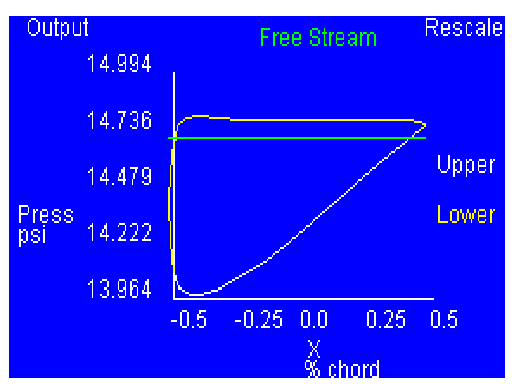
Graph of pressure versus chord from FoilSim
Figure 1

Be careful with scaling. Since the Chord setting in the FoilSim control panel was set at 1 ft., the curves displayed will be from 0 inches to 12 inches, and the area along the X-axis goes from 0 to 144 sq in.

Draw narrow rectangles with equal widths across the region bounded by the curves (as shown in Figure 2) and find the area of each. (Be careful with the scaling.) Create a table and record this information.
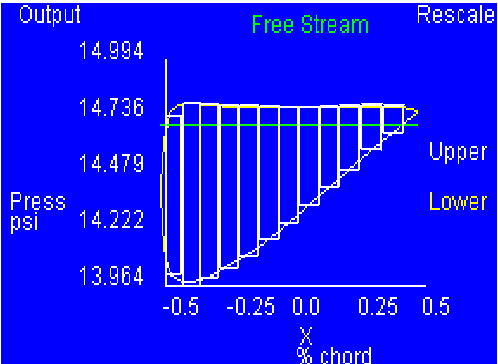
Graph of pressure versus chord with small boxes superimposed
           to determine area under the curve
Figure 2

The total area between the curves is the sum of the individual areas; this value represents the lift force. Compare your value to the value given by FoilSim.

Using the same graph, draw a straight line along the curves as shown in Figure 3.
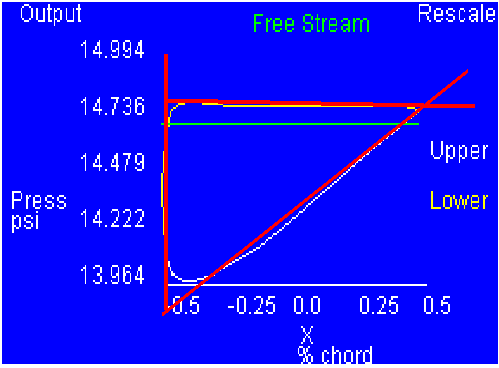
Graph of pressure versus chord with straight lines superimposed
           on the graph lines
Figure 3

Find the slopes of each line and use them to find the respective equations.

Use integration techniques to find the area of the enclosed region; this value represents the lift force. Compare your value to the value given by FoilSim and to your previous value.


Related Pages:
Standards
Worksheet
Lesson Index
Aerodynamics Index


     First Gov Image


+ Inspector General Hotline
+ Equal Employment Opportunity Data Posted Pursuant to the No Fear Act
+ Budgets, Strategic Plans and Accountability Reports
+ Freedom of Information Act
+ The President's Management Agenda
+ NASA Privacy Statement, Disclaimer,
and Accessibility Certification


NASA Logo   
Editor: Tom Benson
NASA Official: Tom Benson
Last Updated: May 13 2021

+ Contact Glenn