|
|
The
Baseball and Air Answers
Step 2.
Using a ruler, measure
the distance between the red ball of the probe and the center of the ball.
How fast is the airstream moving around the ball at this distance?
Distance will vary depending on screen resolution
- typical =
1/2 inch
.
Speed of the airstream depends on speed of pitch - typical =
190 mph
Step 3.
By moving only the
slider to the left of the Probe Gage move the probe above
the ball and take five readings of distance and speed. Record these
in the chart below. Repeat this for five readings below the ball.
Answers
will vary. Samples are shown below:
|
Upper
Distance (X)
|
Upper
Speed (Y)
|
Lower
Distance (X)
|
Lower
Speed (Y)
|
|
5/8
in
|
161.0
mph
|
5/8
in
|
157.2
mph
|
|
3/4
in
|
132.9
mph
|
3/4
in
|
127.0
mph
|
|
7/8
in
|
118.5
mph
|
7/8
in
|
109.2
mph
|
|
1
in
|
103.6
mph
|
1
in
|
102.4
mph
|
|
1 1/8
in
|
79.9
mph
|
1 1/8
in
|
76.0
mph
|
Step 4.
Using two different
colored pens, graph the information from the chart on the graph provided.
Graph #1 will be above the ball, and graph #2 will be below the ball.
Answers will vary, depending on
the answers in Step 3.
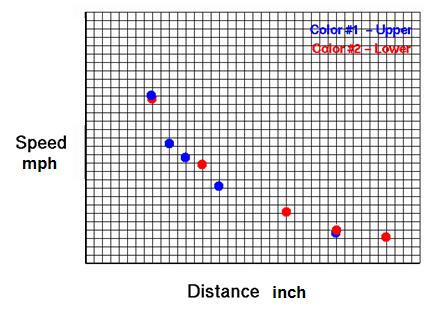
Conclusions:
- What happens to
the airstream as the probe is moved farther from the center of the ball? The
airspeed slows as the distance from the center of the ball increases.
- Why do you think
this happens? The ball disturbs the air locally, but it must return to
free stream conditions far from the ball.
- What happens if
you change the speed of the ball? The local airspeed
magnitude will change, but still decreases as the distance from the ball increases.
- Does this change
what you discovered in Question 1? No.
- Does your result
change if you put Spin on the ball? The local magnitudes will
change top to bottom, but the airspeed still decreases with distance from the ball.
- Examine your graphs.
What kind of a relationship exists between an airstream's distance from
the ball and the speed of the airstream? An
air stream's distance from the ball and the speed of the air stream
are an indirect variation. As the distance from the center of the ball
increases, the airspeed increases.
- Write an equation
for one of your graphs. The graph represents
a quadratic relationship. Therefore, the equation will be in the form
ax2 + bx + c. Several methods can be used to develop the
equation. Using a graphing calculator, the regression equation can be
easily found. It will be similar to 1.25x2 - 43.48x + 549.36,
allowing for differences in recording data.
- Why is this the
correct equation? It is a quadratic equation
that best fits the experimental data.
|