The Cuyahoga River Project
(Stage 3: Student Projects)
The wide range of projects students chose reflected their
interests and talents
- Collages - based on a river theme to project a message.
- Data Analysis and Interpretation - Cuyahoga River water
quality data obtained from Dept. of Interior was used. Different
types of graphs were constructed to reveal relationships. One
date-one test- many sites and/or many dates-one test-one site
graphs are useful for trend analysis. Mean and Median values can
be indicated on the graph. Graphs with more than one test were
used to explore relationships, such as between dissolved oxygen
and temperature. Graphs were made by hand, word processing
software or graphical analysis tools.
- Newspaper articles - One student wrote an article and
submitted it to Sun Star to promote public awareness in the
connection between daily human activities and the water quality of
our streams.
- Posters -pasted around the school to promote cleaner and safer
water.
- Reports - Further research into areas of interests such as
macroinvertebrates as water quality indicators, functions of EPA,
Clean Water Act and RAP. One group report used a word processing
software to create a data base for the water tests and merged into
a document that gave a detailed analysis of the water tests done
on the Cuyahoga River. One student downloaded and compared the
water quality results obtained by schools participating in the
northeast Ohio Rivers Project.
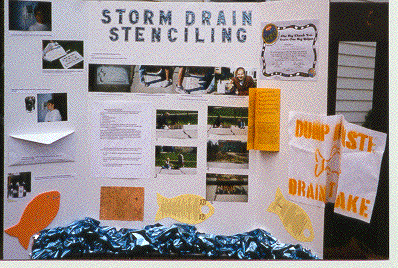
- Storm Drain Stenciling - A group of students stenciled storm
drains with "DUMP NO WASTE ---DRAINS TO RIVER" in two housing
developments, to alert neighborhoods of the connection between
streets and nearby waterways.
- Webpage - Eric Rheberg learned the html on his own for this
project. His experience with Webpages has inspired him to to start
on a commercial Webpage.

Go Back to Cuyahoga River Project
Overview
Go Back to Main Menu