Aerodynamicists use
wind tunnels
to test models of proposed
aircraft and aircraft components. The model is placed in the
test section
of the tunnel
and air is made to flow past the model.
In some wind tunnel tests, the
aerodynamic forces
on the model are measured.
In some wind tunnel tests, the model is instrumented to provide diagnostic
information about the flow of air around the model. Model instrumentation
can include
static pressure taps,
tufts on the surface, or
total pressure rakes.
Some wind tunnel models are designed to determine the performance of a
particular component of the aircraft.
The aircraft
inlet and
nozzle
bring airflow into and out of the
gas turbine
propulsion system.
The performance of the inlet and nozzle depend on both the flight conditions of the aircraft
and the operation of the turbine engine. Special wind tunnel models are used
to determine the performance of the inlet
and the
nozzle.
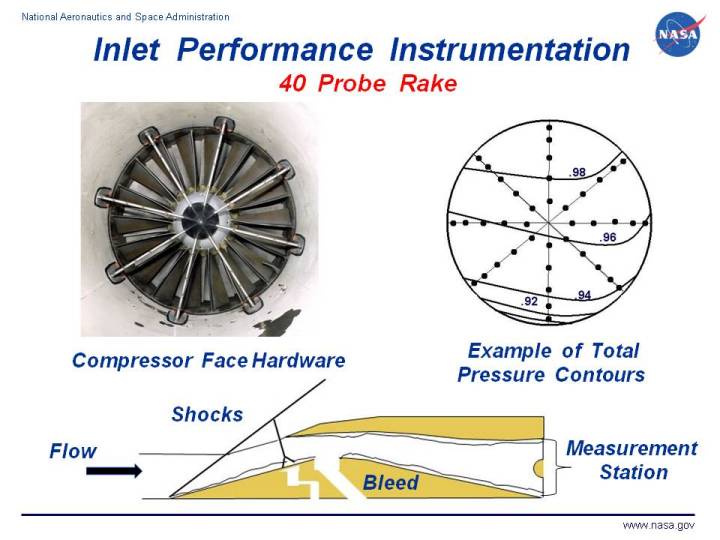
On this page we shall discuss the compressor face 40 probe rake which is
the primary performance instrumentation for an inlet model. At the upper left of the
figure, we show a photograph of a 40 probe rake that was flight tested on the NASA
F-18 at the Dryden Flight Research Center. Similar, but physically smaller, rakes are normally
mounted at the exit of
inlet wind tunnel models.
At the bottom of the figure, we show the location of the 40 probe rake on a
schematic of an external compression inlet.
The rake consists of 40
pitot tubes arranged as five rings with eight probes
spaced 45 degrees apart on each ring. The small probes are difficult to see on the photograph,
so we show a schematic layout of the probes at the upper right of the figure with the black dots
representing the location of the probe tips. As with diagnostic probes, the tubes of the
40 probe rake are connected to pressure transducers to measure the value of the total
pressure relative to some reference value.
During a test, the flow through the inlet duct
generates
boundary layers
along the surface of the inlet and pressure variations across the inlet because of flow
turning, or upstream disturbances, such as shock waves.
The schematic at the upper right shows a typical inlet pressure map with the numbers
indicating lines of constant total pressure,
and the black dots again indicating the location of the pressure probes.
The probes are arranged so that both circumferential and radial variations of the
pressure can be determined. Averaging the 40 measured total pressure values and dividing
by the free stream total pressure produces the measured value of
inlet pressure recovery.
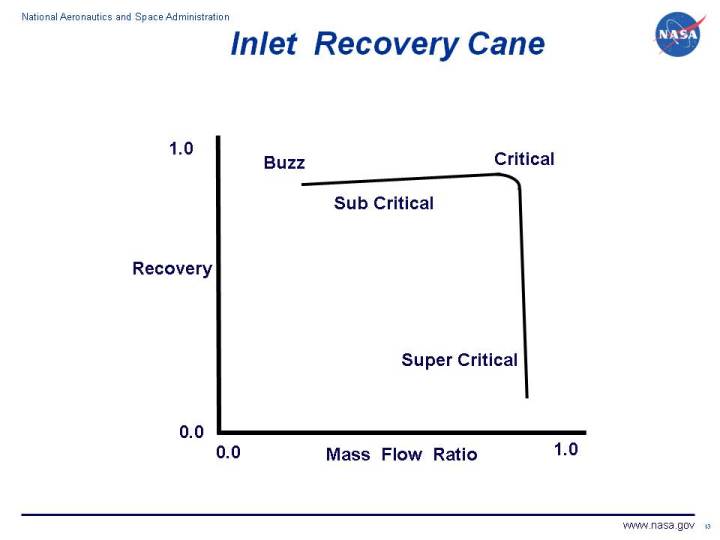
The effects of inlet design and engine operation on total pressure recovery
are expressed in an inlet performance plot called a recovery cane.
The figure shows inlet recovery for a
supersonic
external compression inlet plotted versus
mass flow
ratio at a single free stream Mach number.
The mass flow ratio is the engine mass flow rate divided by the maximum mass flow rate that
can be captured by the inlet. On the schematic at the bottom of the upper figure, we show a
typical capture streamline as the thin horizontal line upstream of the inlet lip.
The recovery is always less than 1.0 because of shock losses and boundary layer losses.
The �knee� of the curve is labeled �Critical� and at this maximum mass flow ratio,
the terminal normal shock sits at the cowl lip.
For the lower mass flow ratios, labeled �Sub Critical�, the normal shock sits off of the cowl lip
and excess mass is spilled around the cowl. At the lowest mass flow ratio the inlet is in buzz,
an unsteady condition in which the normal moves at high frequency in the streamwise direction.
For the �Super Critical� portion of the curve, the normal shock is pulled inside the cowl.
Super critical mass flow ratio remains a constant because the mass flow through the cowl lip
plane is
fixed
by supersonic conditions.
The recovery decreases along the curve because the normal shock is pulled farther back into
the diffuser, with an increase in Mach number upstream of the
normal shock,
and a resulting increase in total pressure loss.
Notice that the mass flow ratio never equals 1.0 because there is always some amount of
supersonic spillage from the external oblique shocks.
During inlet wind tunnel testing, recovery canes are generated over a range of free stream Mach numbers.
The measured pressure values are also used to calculate a wide variety of
distortion coefficients that characterize the inlet flow field.
The simplest coefficient takes the maximum pressure value measured minus the minimum value
divided by the average total pressure.
A more useful distortion coefficient is based on the maximum variation in pressure over a
specified circumferential segment of the compressor face; DC60 for a 60 degree segment,
DC90 for 90 degrees, etc.
More sophisticated coefficients provide mass or area weighted parameters that account for
both radial and circumferential variation.
The wind tunnel test provides values of the inlet distortion coefficient over a range of
flight conditions and exit airflow conditions.
To determine the inlet compatibility with a gas turbine engine, the engine is independently
tested with distortion screens placed upstream of the
compressor.
The screens are designed to produce specified values of selected distortion coefficients.
The engine control schedule is then modified to provide an adequate stall margin across
the engine operating envelope.
Notice that the inlet and engine are not tested together until flight test.
Research efforts are underway to improve the process for determining inlet distortion and
its effect on the engine .
Navigation ..


- Beginner's Guide Home Page
|