IV. EVALUATION
Following is an evaluation
form that could be given to students who participate in labs and projects
that use the wind tunnel. This evaluation could be given as a pre-evaluation
and as a post-evaluation in order to assess whether or not any students
had a change in attitude towards math, science and computing technology
after participation in a wind tunnel lab.
| Student
Survey to use with the Wind Tunnel Project |
|
Name (or student identifier)
|
|
What
grade are you in?
|
|
What
gender are you? (This question is optional)
|
|
Which
best describes your race/ethnicity?
(This question is optional)
|
|
American Indian or Alaskan Native |
Asian or Pacific Islander
|
| Black,
non-Hispanic |
Hispanic
|
| White,
non-Hispanic |
|
| |
|
|
Circle
how often do you use a computer?
|
|
More than once a day |
Once
a month
|
| Once
a day |
Once
a year
|
| Once
a week |
Never
|
| |
|
| |
|
|
If
you use a computer, what do you use it for? (Circle
all that apply)
|
|
Games
|
E-mail
|
| Word
processing |
Accessing
the Internet
|
| Solving
math problems |
Spread
sheets
|
| Graphics
|
Classroom
projects
|
| |
|
| |
|
| |
|
|
Please
circle the number that corresponds best to your opinion on the
following statements.
|
| |
Not
at All
|
|
Great
Extent
|
|
I
would like to pursue a career in engineering, math or science after
high school.
|
1
|
2
|
3
|
4
|
5
|
|
I
feel it is valuable to have technical knowledge in math, science and
computing.
|
1
|
2
|
3
|
4
|
5
|
|
Computers
are a valuable tool used to help solve problems and to visually display
data.
|
1
|
2
|
3
|
4
|
5
|
|
The
Internet is a valuable source to find information on many topics.
|
1
|
2
|
3
|
4
|
5
|
|
I
feel I have a strong background in math, science and computing.
|
1
|
2
|
3
|
4
|
5
|
V. BUILDING
THE TUNNEL
A. DESIGN
A design team
of fifteen students was assembled at General B. O. Davis Jr. Aviation High
School in May of 1995. These students went on a field trip to NASA Lewis
on June 5, 1995, for a wind tunnel project kickoff meeting. The students
received a tour of the various wind tunnels at NASA Lewis in the morning.
In the afternoon, the students were briefed by a NASA engineer, about basic
aeronautical theory and about the parts of a wind tunnel.
The
students began the design of their tunnel once back at school. Two NASA
Engineers participated in the project by going to the school to review the
students’ design and to give suggestions. Once the design was completed,
the students began building the various parts of the tunnel. The construction
of the tunnel was completed during the summer of 1995. The students volunteered
to work on the construction of the tunnel during the summer.
The
wind tunnel contains three main parts, the contraction cone at the front
of the tunnel, the test section in the middle of the tunnel, and the diffuser
at the back of the tunnel. The project team wanted to create the largest
tunnel that their budget would allow. They, therefore, iterated between
the size of the tunnel and the cost associated with it, to determine how
big they could make the tunnel.
The
size of test section and the size of the contraction cone are related through
a contraction ratio. The contraction ratio used, was 12 to 1. This is the
ratio between the area of the contraction cone and the area of the test
section. It was determined that a 5’ x 5’ contraction cone was the maximum
size that could be built. This then dictated that the test section would
be 1.5’ x 1.5’. The shape of the contraction cone was designed by the NASA
Lewis aeronautical engineers working on the project. They developed a bell
curve shape that would cause laminar flow and eliminate flow separation.
It was
determined that an optimal maximum speed for the tunnel would be around
90 mph. The next step was to find the volumetric flow rate of a tunnel with
a 1.5’ x 1.5’ test section and a velocity of 90 mph. Ninety miles an hour
was converted to 132 ft/sec. Next, the area of the test section was found
to be 2.25 square feet. The volumetric flow rate equation is Q = v x A.
So, Q = 132 ft/sec x 2.25 ft squared = 297 cubic ft/sec. This converted
into cubic ft/min, is 17,820 CFM. The size of the motor was based on the
desired CFM output of the fan. With a 5 hp motor, a 36” diameter fan can
move 20,650 cubic feet of air per minute, this was greater than the desired
CFM output, so these two pieces of equipment were selected.
The
length of the diffuser section was dictated by the size of the fan, which
was selected to be 36” in diameter. A square to round conversion piece
was designed and the square portion turned out to be 34” x 34”. This became
the dimensions of the end of the diffuser section. The diffusion angle
was kept below 6 degrees. The diffusion angle ended up being 2.9 degrees
on each side for a total of a 5.8 degree diffusion angle. This made the
diffuser section 13’ long. Figure 1. provides further explanation about
the diffusion angle and the diffuser section.

Figure
1.
One
of the NASA engineers on the project provided calculations to ensure that
the wind tunnel structure that was designed would be able to withstand the
pressures that would be created by the tunnel. He calculated the pressure
per square foot that would be theoretically created by a tunnel of this
size and specification. This was compared to the loading standards of the
materials used, Plexiglas and plywood and it was determined that the wind
tunnel would be able to withstand the pressures. The wind tunnel was to
be housed next to a roll up door that led to the outside and the plan was
to open the door when running the wind tunnel, to vent the exhaust. Therefore,
the air pressure forces created when the tunnel was running, was not a concern
within the building.
B. CONTRACTION
CONE
The contraction
cone, also referred to as the inlet, was the only piece that was not fabricated
by the students, due to its the size and complexity. The fabrication of
this piece was contracted to Avon Sheet Metal Co. The students specified
the size and shape of the cone for the fabricators. Figure 2. shows the
specifications developed.

Figure
2.
C. TEST SECTION
The test section is 1.5’
x 1.5’. The test section is made out of plywood with Plexiglas viewing windows.
One of the students became concerned that the Plexiglas protruding from
the plywood frame would create places for error once the tunnel was used
for testing. Therefore the Plexiglas was inset into the plywood. Figure
3. shows the test section.

Figure
3.
D. DIFFUSER
SECTION
Once the dimensions
of the diffuser were calculated, how to build it had to be determined.
The main problem was that an eighteen inch square had to be centered in
a thirty-four inch square, thirteen feet apart. The solution was to build
a jig for the diffuser section, that was later modified and used as the
support for the whole tunnel. Figure 4. shows the dimensions of the diffuser.

Figure
4.
E. FAN SECTION
A 36 inch
fan was purchased to create the airflow of the wind tunnel. This was attached
to the back of the diffuser section.
F. MOTOR
The 5hp motor
and a drive unit were donated by Eurotherm Corporation. The motor was mounted
on top of the fan. The drive unit was used to convert AC power to DC power
and to control the speed of the motor.
G.
FLOW STRAIGHTENER
A
honeycomb material, donated by Hexal Corporation, was mounted to the front
of the contraction cone and used as a flow straightener,
H.
INSTRUMENTATION
Twelve pressure
transducers are used to collect pressure readings. Tycon tubing is used
to connect the pressure transducers the test points inside the test section.
Inside the test section, probes are attached to the tubing. The location
of the probes vary within the test section depending on the test article.
The pressure transducers were mounted into an electrical box to protect
them from the environment. Students from the school’s electronics class
worked on this part of the project. From the electrical box, the transducers
were then connected to a 16 channel A/D board which was installed inside
a 486 IBM compatible computer. The software package, Control, was used
to display the data on the screen.
VI. EXPERIMENTS
A.
VENTURI
The
first test object created was a venturi. A venturi is defined as a short
tube with a constricted throat that is used to determine fluid pressures
and velocities by measurement of the differential pressures generated at
the throat, as fluid traverses the tube. The venturi was chosen as the first
test object because it could be used to verify that accurate data could
be obtained from the tunnel. If the readings obtained from the tunnel closely
matched theoretical calculations, verification, that the wind tunnel and
instrumentation were functioning properly, would be obtained.
Additionally,
the venturi was selected as a test object in which to demonstrate a basic
aeronautic phenomenon, Bernoulli’s Principle. When air flows through a venturi,
the physical properties of the venturi cause the velocity of the air at
the beginning of the venturi to be slower than at the middle of the venturi.
The air velocity is also slower in the back of the venturi than in the middle.
Bernoulli’s principle states that there is an inverse relationship between
air velocity and air pressure, which will be explored in more detail later
in this report. But having said that, the air pressure within the venturi
will be greatest in the middle and lower at the front and back.
Two
attempts to create a venturi with which meaningful readings could be gathered
failed. These two attempts are explained. The first venturi had an hourglass
shape and was made out of two pieces of Plexiglas. This venturi was put
into the wind tunnel for testing, with probes located throughout the venturi
with which to collect pressure readings. Pressure readings were obtained
from the inlet of the venturi, but the pressure transducers read zero, for
the middle and back sections of the venturi. These pressure transducers
and probes were switched with the probes used in the front of the venturi,
to make sure they were working correctly, and they were. So, it was decided
that inlet area of the venturi was too restrictive and was not allowing
airflow through the rest of the venturi. It was determined that a venturi
with a bigger inlet should be made.
The
second venturi was made from fiberglass into an hour glass shape. This time
pressure readings were obtained from the front and middle sections of the
venturi, but the data from the back portion of the venturi was the same
as in the middle section. One of the NASA engineers helping with the technical
aspects of the project, suggested that the diffusion angle of the venturi
(the angle between the middle section and the back section of the venturi)
rose at too sharp of an incline and was causing air separation in the back
portion of the venturi. The problem was researched and it was found that
the diffusion angle should be no greater than 6 degrees, in order for the
venturi to function correctly.
The
third attempt was successful. The entire test section was made into a venturi.
Sheet metal was formed into the shape shown in Figure 5. The location of
the probes, which were used to collect pressure readings at six different
points, are illustrated in Figure 5. The test data that was obtained
is shown in Figure 6. The graphs in Figure 6. can be used to illustrate
Bernoulli’s Principle. As the velocity increases, the pressure decreases
and as the velocity decreases, the pressure increases. The students transferred
the data from the data collection program into a ClarisWorks spread sheet
and completed the graphs using the data. The outcome of the comparison of
experimental velocities to theoretical velocities is shown in Figure
7.

Figure
5.
Collection of Experimental
Data


Figure 6.
Comparison of Experimental
and Theoretical Velocities
from the Wind Tunnel
|
Experimental
Velocities
|
|
|
|
|
|
| |
|
|
|
|
|
Square inch
Area of the Venturi
|
|
Tunnel Velocity
|
35
|
45
|
55
|
65
|
75
|
327.6
|
|
Velocity 0
|
42.53
|
50.62
|
59.2
|
68.9
|
79.13
|
280.6
|
|
Velocity 1
|
52.85
|
63.08
|
73.8
|
85.4
|
98.1
|
224.4
|
|
Velocity 2
|
65.15
|
77.9
|
90.8
|
105.2
|
118.8
|
210
|
|
Velocity 3
|
49.6
|
58.07
|
68.5
|
78.8
|
89.8
|
244.3
|
|
Velocity 4
|
45.8
|
54.5
|
63.8
|
74.4
|
84.7
|
275.1
|
|
Velocity 5
|
41.5
|
48.18
|
56.4
|
64.1
|
73.7
|
296.8
|
| |
|
|
|
|
|
|
| |
|
|
|
|
|
|
|
Theoretical Velocities
|
|
|
|
|
|
| |
|
|
|
|
|
Square inch
Area of the Venturi
|
|
Tunnel Velocity
|
35
|
45
|
55
|
65
|
75
|
327.6
|
|
Velocity 0
|
40.86
|
52.54
|
64.21
|
75.89
|
87.56
|
280.6
|
|
Velocity 1
|
51.10
|
65.70
|
80.29
|
94.89
|
109.49
|
224.4
|
|
Velocity 2
|
54.60
|
70.20
|
85.80
|
101.40
|
117.00
|
210
|
|
Velocity 3
|
46.99
|
60.42
|
73.84
|
87.27
|
100.70
|
244
|
|
Velocity 4
|
41.68
|
53.59
|
65.50
|
77.40
|
89.31
|
275.1
|
|
Velocity 5
|
38.63
|
49.67
|
60.71
|
71.75
|
82.78
|
296.8
|
| |
|
|
|
|
|
|
| |
|
|
|
|
|
|
|
Experimental Error
|
|
|
|
|
|
|
| |
|
|
|
|
|
Square inch
Area of the Venturi
|
|
Tunnel Velocity
|
0
|
0
|
0
|
0
|
0
|
327.6
|
|
Velocity 0
|
4.08
|
3.65
|
7.81
|
9.21
|
9.63
|
280.6
|
|
Velocity 1
|
3.43
|
3.98
|
8.09
|
10.00
|
10.40
|
224.4
|
|
Velocity 2
|
19.32
|
10.97
|
5.83
|
3.75
|
1.54
|
210
|
|
Velocity 3
|
5.55
|
3.89
|
7.24
|
9.71
|
10.82
|
244
|
|
Velocity 4
|
9.89
|
1.70
|
2.59
|
3.88
|
5.16
|
275.1
|
|
Velocity 5
|
7.42
|
3.00
|
7.10
|
10.66
|
10.97
|
296.8
|
Figure
7.
B. 2415
NACA AIRFOIL
The second test object
created was a 2415 NACA airfoil. The correct shape for an 2415 NACA airfoil
with an eight inch chord was obtained from references. The airfoil itself
was made out of wood and sheet metal. Five ribs where made from 3/4 inch
pine wood. Dowel rods were used to connect the ribs together, this completed
the form. Sheet metal was then bent over and glued to the top of the form.
Next, instrumentation tubes were installed. The airfoil was then mounted
on a steel plate and secured to the wall of the test section with three
bolts, see Figure 8. In the wall of the test section three slots
were cut which allowed the airfoil to rotate from -8 degrees to +25 degrees.
A protractor was used to determine the angle. The 0 degrees mark was lined
up with where the wing was horizontal. Lastly, the sheet metal was glued
to the bottom of the form.
The
airfoil was used to demonstrate how lift is created. Additionally, the
airfoil was used to explain angle of attack and stall. Tufts of yarn were
added to the model to visualize the airflow. The students were able to
see when the airfoil first began to stall; the pressure readings on the
computer dropped and the tufts began to swirl.
Students
collected the pressure readings, shown in Figure 9., from the airfoil
as it was rotated in two degree increments. They started at a negative
angle of attack and took readings until the airfoil stalled. Students created
a graph from the data they collected. Refer to Figure 10. to see
how the graphs illustrate that at a negative angle the lower surface creates
a lower pressure, at -2 degrees there is no lift and at 11 degrees the airfoil
begins to stall. (Had the angle marking system been more accurate, 0 lift
would have occurred at 0 degrees.)
The
data collected, by the students, on the 2415 NACA airfoil was used to calculate
the pressure coefficient and the lift coefficient of the airfoil. It was
then compared to a computer simulation of the same type of airfoil. The
readings where satisfactorily accurate. See Figure 9. for the spread
sheet created to calculate the coefficients and Figure 11 though Figure
16 for a graph of the results. Refer to the Lesson Plans to see how to
calculate the coefficients.

Figure
8.

Figure
9.

Figure
10.
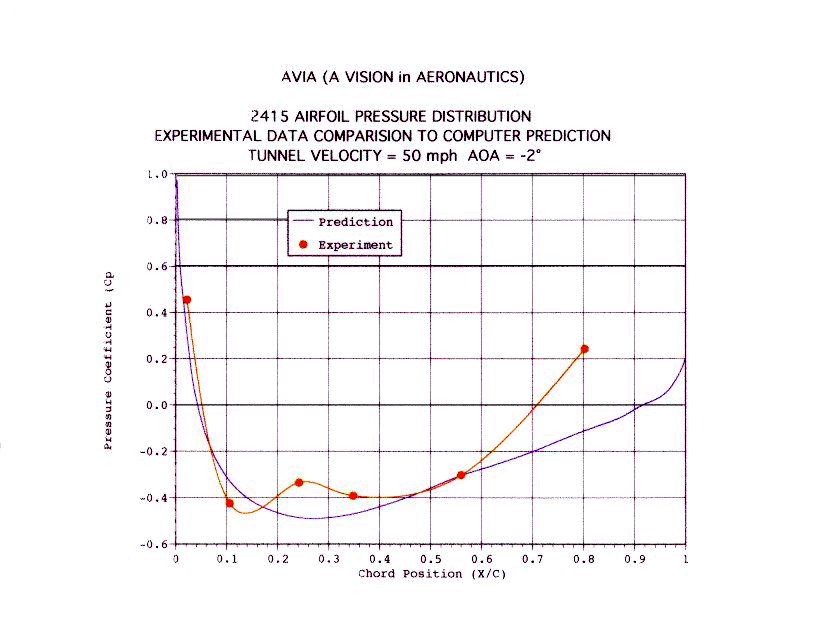
Figure 11
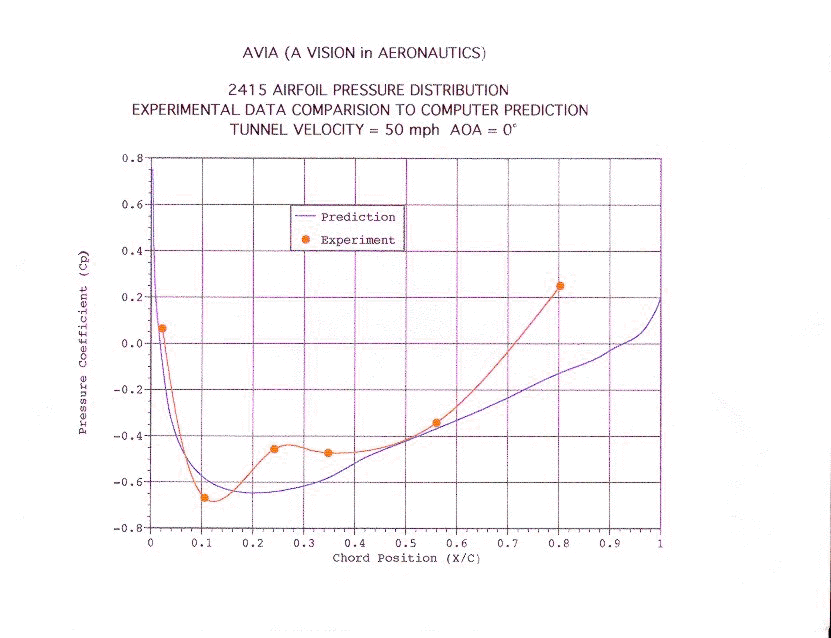
Figure 12
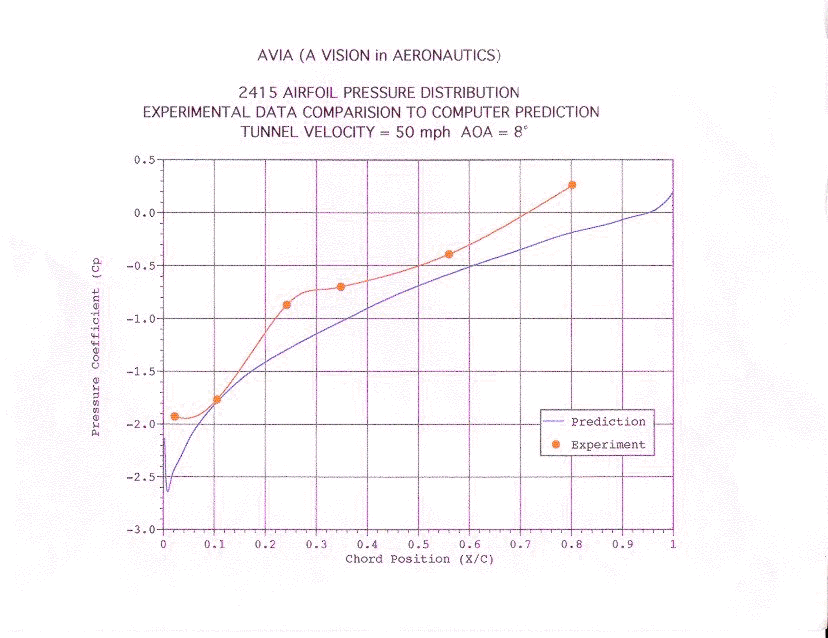
Figure 13
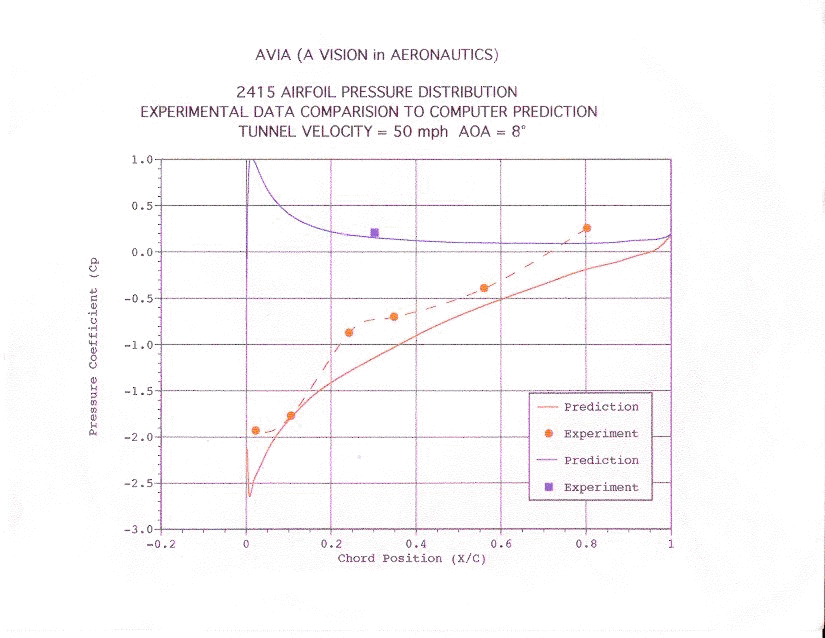
Figure 14
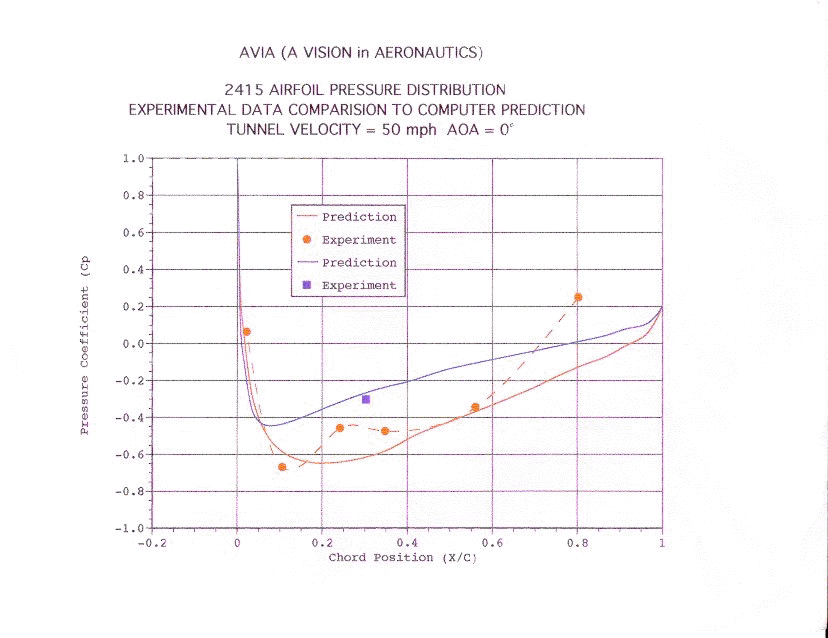
Figure 15
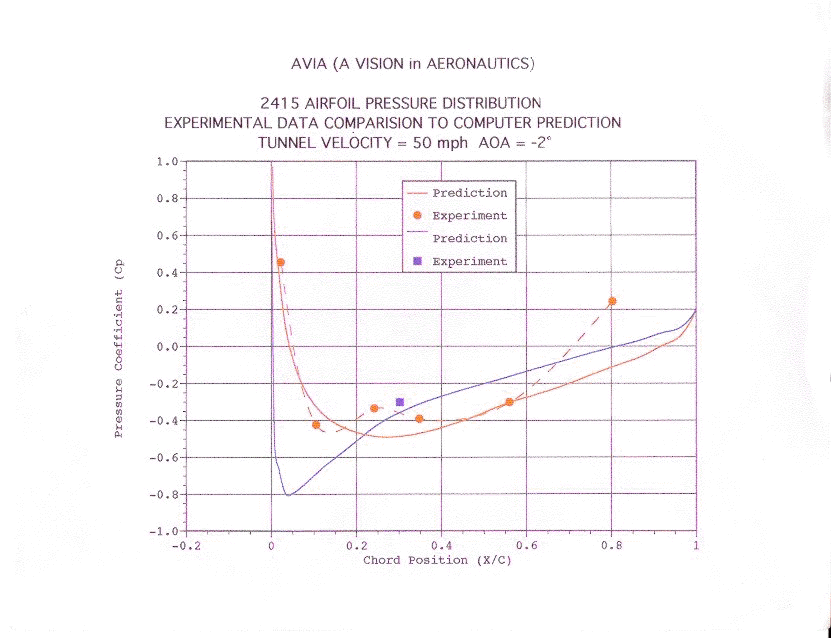
Figure 16
C.
WHEEL PANT PROJECT
The wind tunnel
team was contacted by researchers in the NASA Lewis Structural Systems Branch.
These researchers were interested in using the Aviation High School wind
tunnel to perform initial tests on a NASA Lewis research project. The purpose
of project was to design a wheel pant for small private aircraft. A wheel
pant is an aerodynamic cover for the wheel of aircraft that do not have
retracting landing gear.
The
students built a strut and attached a 3/8” diameter rod and the 4.5” diameter
wheel and the 1/3 scale fiberglass wheel pant to it that were supplied by
the NASA engineers. This structure was mounted in the wind tunnel and testing
occurred to determine if drag could be reduced by using the wheel pant.
Drag is a force and this force was measured with gram weights on a balance/pulley
system, see Figure 17. The middle of the strut was mounted to the test
section floor, but it was able to pivot back and forth. When the tunnel
was turned on, the top of the strut started to move backwards due to drag
and the bottom of the strut moved forward, since it was pivoting in the
middle. A string was attached to the bottom of the strut and run through
a pulley. The other end of the string was attached to pan which held gram
weights. Gram weights were placed on the pan until the strut was straight
again. The weight, in grams, corresponded to the drag of the strut system.
Three
tests were performed. The first test was on the strut and wheel alone. The
second test was on the wheel and the wheel pant, with the tire protruding
from the bottom of the wheel pant. The third test was on the closed wheel
pant; no tire was protruding. Measured forces were 200g for the strut
and wheel, 150g for the strut, wheel and pant, and 120g for the strut and
closed wheel pant. These initial readings showed that the wheel pant does
appear to reduce drag.

Figure
17.
Navigation ..

- Beginner's Guide Home Page
