NPARC Alliance Validation Archive
Validation Home >
Archive >
S-Duct Inlet >
Study #1
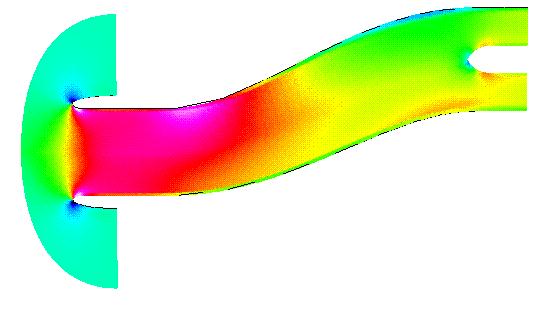
This validation case is an example case illustrating the computation of subsonic, inviscid flow through an s-duct inlet. The WIND results are compared with experimental data, and with the results of the NPARC Validation S-Duct Example Case.
All of the archive files of this validation case are available in the Unix compressed tar file sduct01.tar.gz. The files can then be accessed by the commands
uncompress sduct01.tar.gz
tar -xvof sduct01.tar
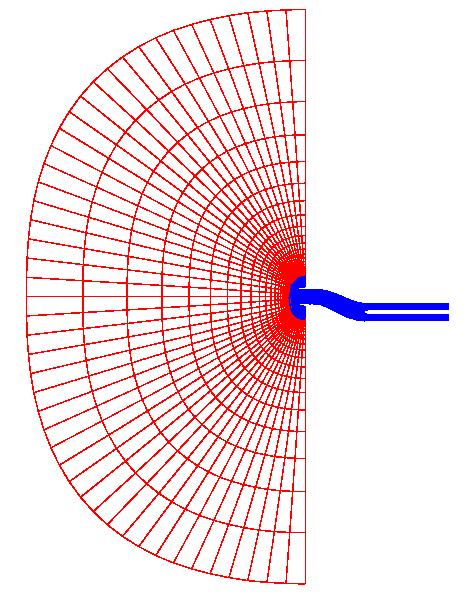
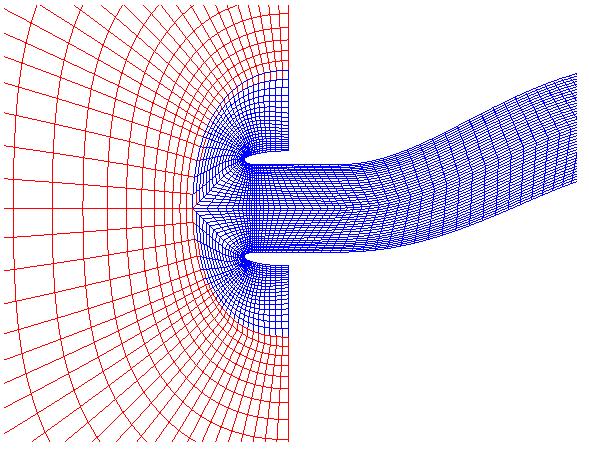
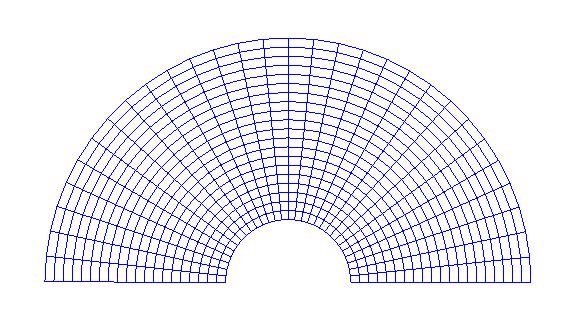
The grid, sduct.i.x.bin, from the NPARC example case, was modified using the FORTRAN program gridmod.f to eliminate the overlap between the K1 boundary of block 1 and the KMAX boundary of block 2. The resulting grid was called sduct.new.x.bin; block 1 has 25x31x21 points and block 2 has 123x31x21 points. Within block 1, the grid was clustered lightly toward the inlet wall with the minimum spacing of approximately 0.1 inches. The grid is shown in Fig. 2. The grid in the formatted, multi-block Plot3D format is available in the file sduct01.x.fmt.
The PLOT3D file was converted to the common grid file (*.cgd) format using the CFCNVT utility. This was done using the command:
cfcnvt < cfcnvt.com
where the file cfcnvt.com is a command input file. A common grid fle named sduct.cgd is created.
An initial condition of freestream flow was used, as given in Table 1:
| Mach number | Total Pressure (psia) | Total Temperature(R) | Angle-of-Attack (deg) |
|---|---|---|---|
| 0.21 | 14.67 | 527.0 | 0.0 |
For both blocks 1 and 2, INVISCID WALL boundary conditions were used for the duct surfaces, including the bullet nose region. The INVISCID WALL boundary condition was also applied at the symmetry boundaries (the J1 and JMAX planes). CONFINED OUTFLOW was used at the I1 boundary in block 1, with the static pressure specified as 14.227 psi in the GMAN sduct.dat file. (The is consistent with freestream flow having a Mach Number of 0.21). The CONFINED OUTFLOW condition was also specified at the IMAX boundary in block 2, with the static pressure specified as 13.780 in sduct.dat (this produces an exit Mach number of 0.304). The AUTO COUPLE condition was used to couple the K1 boundary of block 1 with the KMAX boundary (for I = 1 to 24) of block 2. For the two remaining boundaries in block 1, the SINGULAR AXIS condition was used at the IMAX boundary, and the INFLOW/OUTFLOW condition was used at the KMAX boundary. In block 2, the INFLOW/OUTFLOW condition was used at the I1 boundary. Three different boundary conditions were used on the KMAX boundary in block 2: for I = 1 to 24, AUTO COUPLE was used, as mentioned above; for I = 25 to 79, SINGULAR AXIS was used; and for I = 80 to 123, INVISCID WALL was used.
The boundary conditions are specified using GMAN. This was done using the command:
gman < gman.com
where the file gman.com is a command input file. This file instructs GMAN to read in the sduct.cgd grid file, change the units to feet (the default units are inches) and to set all of the boundary conditions. This could also be done using GMAN's graphical mode. (For a good example case using GMAN's graphical mode, see the Laminar Flat Plate case.)
The computation is performed using the time-marching capabilities of WIND to approach the steady-state flow starting from the freestream conditions.
The input data file for WIND is sduct.dat. The TURBULENCE INVISCID keyword indicates that WIND is to solve the Euler equations. The DOWNSTREAM PRESSURE 14.22667 ZONE 1 keyword indicates the value of the constant pressure applied at the confined outflow boundary in zone 1. The pressure for the confined outflow boundary in zone 2 is defined in the same manner. The Test 150 2 option tells WIND to zero the y-component of velocity on the singular axis boundaries when the symmetry plane test fails. The CFL keyword indicates that the CFL number is set to the default value of 1.3, and the CYCLES keyword indicates that WIND is to run for 10000 cycles, with the default of 5 iterations per cycle. Note that this WIND calculation was terminated after 6910 iterations; this was done by inserting the file NDSTOP , which contains only the word "STOP", in the directory in which WIND was running. The LOADS keyword specifies that the mass flux in zone 2 at planes i = 90 and i = 123 should be printed to the list output file (*.lis) every 50 iterations. The HISTORY keyword specifies that the pressure at the two specified locations should be written to the time history file (*.cth) every 50 iterations.
The WIND solver was run interactively. At the appropriate prompt, the input data file, sduct.dat, was specified. The default names for the common grid file, sduct.cgd, and the list output file, sduct.lis, were used.
This computation was performed on a Silicon Graphics Indigo2 workstation with a R8000 75 MHZ IP26 processor and 128 Mbytes of main memory.
The RESPLT utility was used to obtain convergence history information from sduct.lis. The following command was used to obtain the file chist.l2.gen, which contains the L2 residual in GENPLOT format.
resplt < resplt.nsl2.com
Where the file resplt.nsl2.com is a command input file. In the same manner, the command file resplt.mass.com was used to create the GENPLOT file chist.mass.gen containing the mass flux history at the exit plane of zone 2. These results are shown in Figure 3.

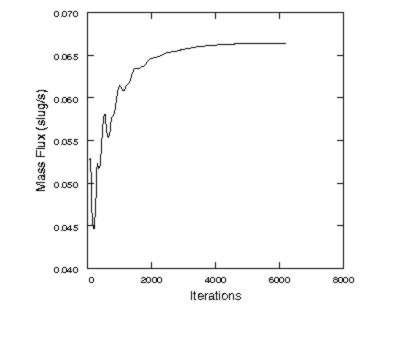
The default convergence level for the largest residual appears to be set to 1E-06, therefore zone 1 is considered to be converged after about 600 iterations. After this point, only one iteration per cycle was performed on zone 1, resulting in fewer total iterations for zone 1 (2275 for zone 1, compared to 6910 for zone 2).
The PLOT3D solution file, sduct.q.bin was created from the WIND common flow file, sduct.cfl using the following command:
cfost < cfpost.com
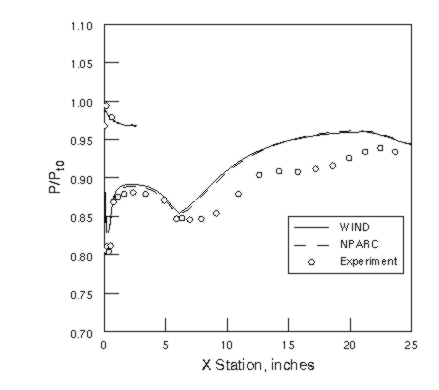
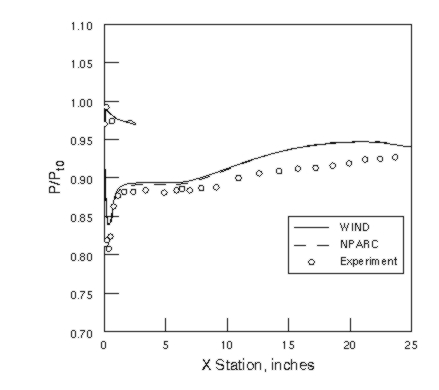
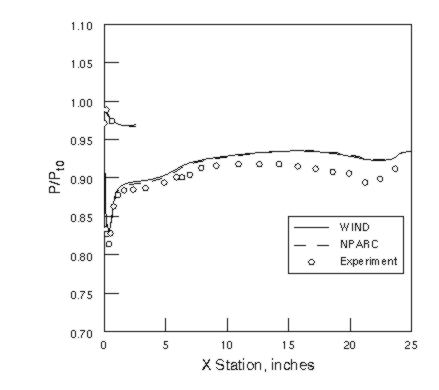
where cfpost.com is a command file. sduct.q.bin is PLOT3D unformatteg, multi-block and three-dimensional. PLOT3D was used to extract three axial pressure profiles from sduct.q.bin. These are plotted in Figure 4, along with the NPARC results and experimental data.
The computation of this case required 81994.37 seconds to compute 1382 total cycles with 2275 iterations in zone 1 and 6910 iterations in zone 2.
This case was created on June 5, 1998 by Julianne C. Dudek, who may be contacted at
NASA Glenn Research Center, MS 5-12
21000 Brookpark Road
Cleveland, Ohio 44111
Phone: (216) 433-2188
e-mail: Julianne.C.Dudek@grc.nasa.gov