Area
Under A Curve Activity
If so instructed by your teacher, print out a worksheet page for these
problems.
Activity:
Open FoilSim and set the following conditions:
Speed = 100 mph
Altitude = 0 ft
Angle = 5 degrees
Thickness = 12.5 %
Camber = 5.0 %
Area = 1000 sq ft
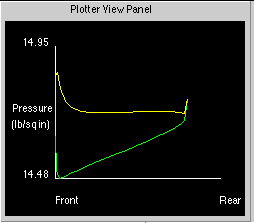
As the altitude changes,
examine the graphs of Surface Pressure seen on the Plotter View Panel.
|
On a piece
of graph paper, sketch a view of the graphs seen on the Plotter
View Panel as carefully and as accurately as possible.
Change the
altitude. On the same piece of graph paper, sketch
the new view seen on the Plotter View Panel.
Repeat this
procedure three more times. Sketch each succeeding view on the
same piece of graph paper carefully and accurately.
|
|
Using the procedures
found at Getting a Little
"Lift" out of Calculus - Part I created by Jim Zaborowski of Urbana
High School, find the areas between the curves for each of the five sketches.
This area is equal to the lift of the airfoil.
Compare the areas (lift)
and the altitudes at which they were created. Make a reasonable observation
about the results.
|