As an object moves through the air, the air resists the motion of
the object. This resistance is called aerodynamic drag.
Drag is present on all objects moving through the air from
airliners
to
baseballs.
Drag is the component of the
aerodynamic force
that is aligned and opposite to the flight direction.
On this page we will discuss some of the details of the drag on a soccer ball.
The details of how a moving soccer ball creates drag are fairly complex.
If we move with an object through the air,
the object appears to stand still and the
air moves past the object at the speed of the object.
Next to the surface of the object, the molecules of the air
stick to
the surface, as discussed in the
properties of air slide. This thin
layer of molecules pulls on the surrounding flow of air.
The relative strength of the
inertial (momentum)
and
viscous
forces in the flow determines how the flow moves around the
object and the value of the drag of the object. The
ratio
of the inertial force to the viscous force is called the
Reynolds number.
The equation for the Reynolds number is:
Re = rho * V * d / mu
where rho is the
air density ,
V is the velocity, d is the diameter of the ball,
and mu is the
air viscosity.
If the value of the Reynolds number is very low (~100), the viscous forces dominate the
inertial forces and thick laminar boundary layers are formed on the surface of the
object. If the Reynolds number is very large (~ 10^7), the inertial forces dominate the
viscous forces and the boundary layer is thin.
Unfortunately, the state of the boundary layer is not the only
factor
that determines the drag on an object.
Size ,
shape ,
and
atmospheric conditions
also affect the value of the drag. To predict the value of drag, aerodynamicists
use the
drag equation:
D = .5 * rho * V^2 * A * cd
where D is the drag, A is the cross-sectional area, and
cd is the
drag coefficient
a number that represents all of the complex factors affecting drag.
Drag coefficients for a specific object are
determined experimentally
using a model in a
wind tunnel.
For flow past a ball, determining the drag coefficient gets a little more
confusing. The drag on a ball is being generated by the boundary layer
separating from the back of the ball. As the flow separates, it creates a
viscous wake behind the ball. A large, wide wake generates a large amount of drag;
a thin wake produces less drag. The thickness of the wake, and the
drag on the ball,
depends on the conditions in the boundary layer which, as we have seen, depends
on the Reynolds number.
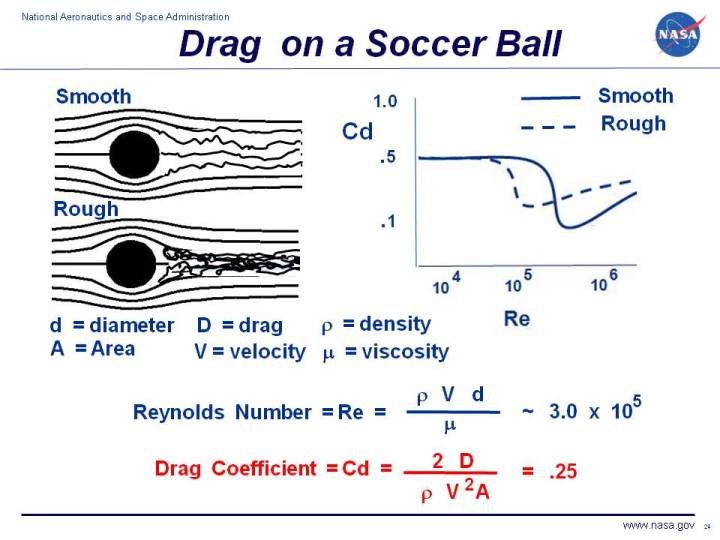
For the graph on the right of the figure, we show some experimental data for a smooth
ball (solid line).
The drag coefficient has a high value at low Re values, then drops down to
a lower value from which it continues to increase with increasing Re.
The interpretation of the curve is that, at lower Re values, the boundary layer is laminar
and the wake is thick. As Re increases,
the boundary layer transitions to turbulent, which initially
produces a thinner wake, but with increasing speed and Re, the wake thickens and the
drag increases.
For a soccer ball, the diameter is .75 feet, sea level static air density is 2.37 x 10^-3
slug/ft^3, viscosity coefficient is 3.61 x 10^-7 slug / ft sec and, if the ball
is kicked at 40 mph, the value of the Reynolds number is approximately:
Re (soccer ball) = 3.0 x 10^5
From the curve for a smooth ball, this low Reynolds number value
would indicate that the flow in the boundary layer is transitional, and
the drag coefficient is between .5 and .1, approximately:
Cd (smooth) ~ .25
But we know that a soccer ball is not a smooth ball. The stitches on the ball produce
surface roughness that disturbs the boundary layer, causing the boundary layer to
transition at a lower value of the Reynolds number than for a smooth ball.
We show a second line on the
graph that is more representative of a rough surfaced soccer ball (dashed lines).
From this graph, the value of the drag coefficient for a soccer ball is approximately:
Cd (soccer ball) = .25
This is the value of drag coefficient that is used as the default in the
SoccerNASA simulation program. Within the
program you can re-set the value to another value to see the effects of drag on the
trajectory of the kick.
Activities:
Guided Tours
Navigation ..

- NASA Soccer Home Page
- Beginner's Guide Home Page
|